Dead Volume Effects on Early-Eluting Peaks in HPLC
Quick diagnostic guide for Dead Volume Effects on Early-Eluting Peaks in HPLC: isolation steps and corrective actions to recover resolution.
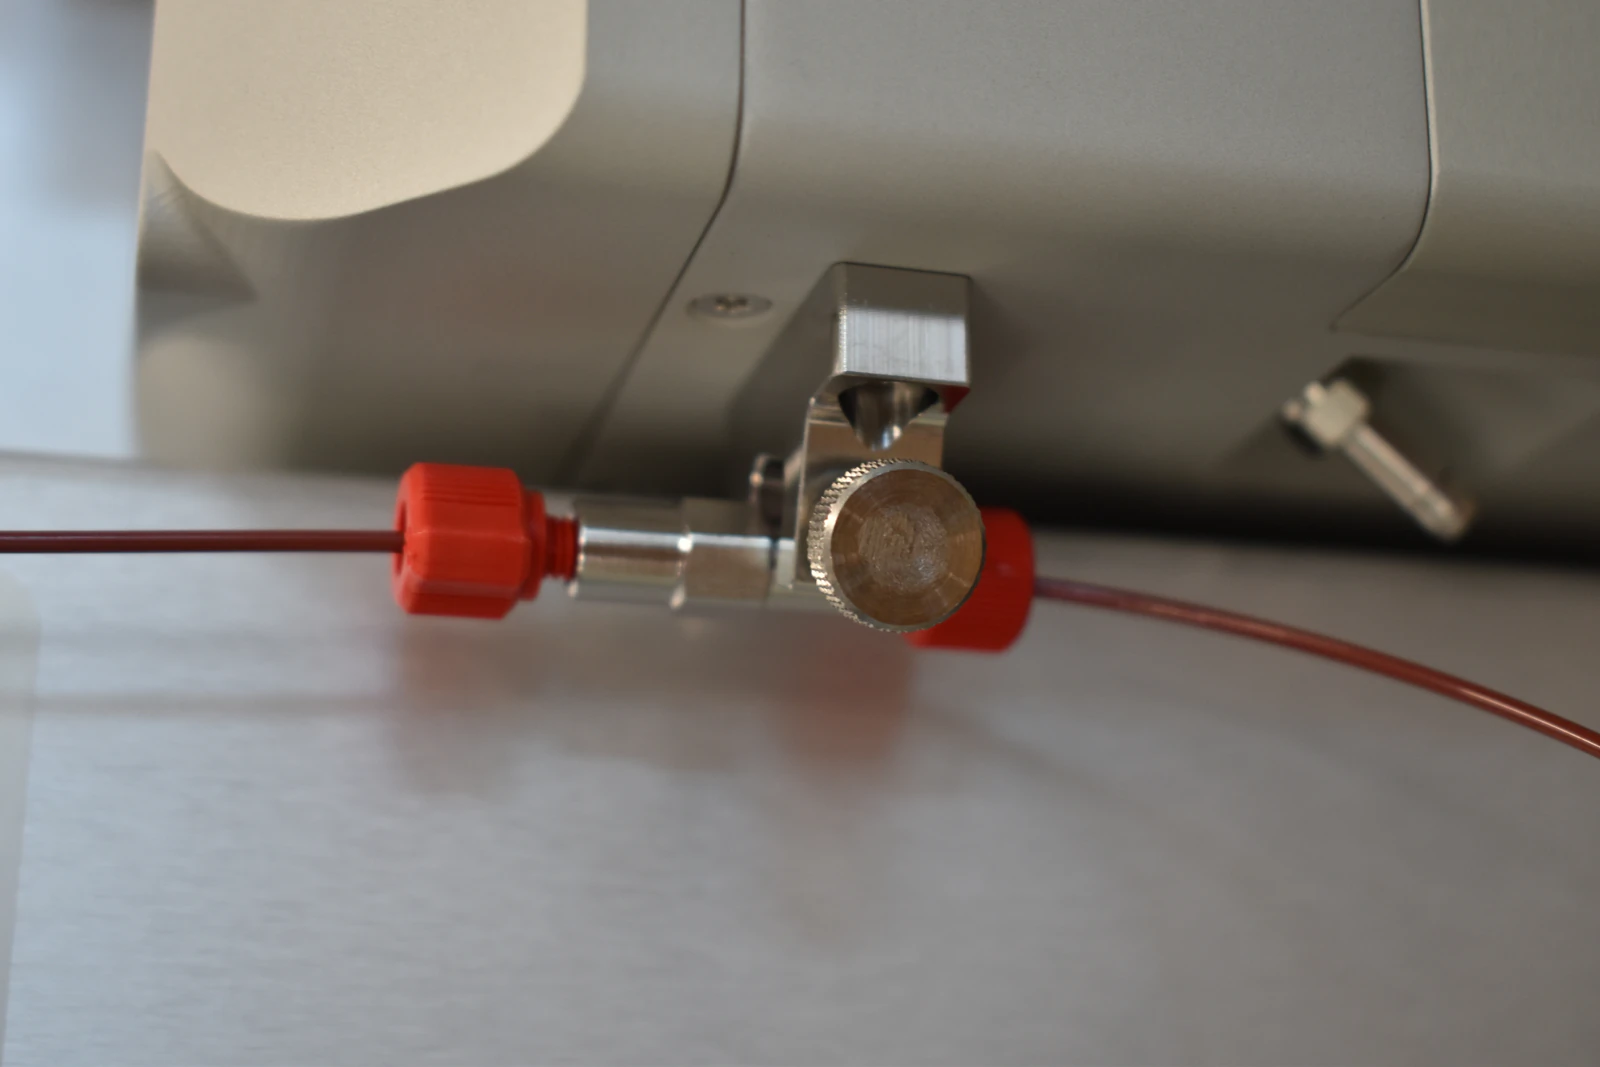
A Technical Troubleshooting Guide for Peak Shape Near t₀, Resolution Loss, and Apparent “Poor Column Efficiency”
Overview
Dead volume—also referred to as extra-column volume or extra-column dispersion—is the volume outside the packed bed of the column that the sample band experiences from injection to detection. It includes the injector/autosampler, mixer, connecting tubing, fittings/unions, guard column or inline filter housings, the detector flow cell, and any post-column devices.
For early-eluting peaks (low retention; low k′), even small extra-column volumes can dominate band broadening because the intrinsic column contribution is still small near the void time (t₀). The result is broad, fronting, or tailing peaks close to t0, reduced resolution among the first components, and a strong sensitivity of early peak shape to injection and system conditions.
Key principle: variances add (in the time domain):
σ_obs^2 ≈ σ_column^2 + σ_ec^2
where σ_ec is the extra-column contribution expressed in time. Because σ_column is small for low k′, σ_ec becomes the limiting term for early peaks.
Why Early Peaks Are Disproportionately Affected
Early peaks have less time to “benefit” from on-column separation and focusing. In practical terms:
The column has not yet produced much retention-driven band shaping.
Any dispersion added by injector, tubing, fittings, mixer, and detector is applied before the band becomes well-separated.
Therefore, a fixed amount of extra-column dispersion consumes a larger fraction of the total peak width for early peaks than for later peaks.
This is why you can see acceptable peak shapes for mid/late analytes while early peaks remain compromised—even though the system is the same.
Typical Symptoms
Early peaks (k′ ≲ 1–2) are broad, fronting, or tailing; later peaks look acceptable.
Resolution among early analytes does not improve when using a longer column but improves when reducing system dispersion.
Early peak widths change markedly with flow rate or injection volume; later peaks change little.
In gradients: first peaks elute later than expected and are broader; retention shifts with changes to dwell/mixing volume.
Data acquisition artifacts: flattened or under-sampled early peaks at low detector sampling rates.
Quick Diagnostics
Union (Column-Bypass) Dispersion Test
Remove the column, install a zero-dead-volume union, and inject a tracer (e.g., 0.1% acetone in water).
Measure tracer peak width at the detector to estimate system dispersion.
Repeat at two flow rates to assess the expected
σ_ec ∝ 1/Fbehavior.
Flow-Rate Dependence Check
Compare early peak widths at two flows (e.g., 0.3 vs 0.6 mL/min).
If peak width in time decreases approximately with
1/F, extra-column broadening is significant.
Injection Contribution Check
Reduce injection volume by 2–5× and/or strength-match injection solvent to initial mobile phase.
If early peaks sharpen quickly, injection-induced dispersion is a major driver.
Component Bypass Localization
Bypass suspected high-volume elements:
guard column
inline filter housing
static mixer / large mixer
long tubing loops
large-volume detector cell
Any large improvement localizes the culprit.
Dwell Volume (Gradient Delay) Check
Replace column with a union and program a steep step (e.g., B: 5%→95%).
Monitor UV using a wavelength with different A/B absorption (or add a tracer).
The time to the baseline step is
t_dwell = V_dwell / F.
Root Causes and Corrective Actions
1) Injection and Autosampler
Cause
Injection volume too large relative to column volume.
Injection solvent stronger than initial mobile phase (poor on-column focusing).
Partial-loop injection dispersion.
Large needle seat/pre-injector volume.
Fixes
Strength-match diluent to initial eluent; keep organic content at or below the initial condition.
If solubility requires a stronger solvent, keep the strong component ≤10–20% and add weak solvent plus additive to maintain solubility without excessive solvent strength.Reduce injection volume. A common rule: keep
V_inj ≤ 1–2%of column void volume when early peaks are sensitive.
Example (as provided): for a 2.1 × 50 mm column,V0 ≈ 118 µL, so aim forV_inj ≤ 1–2 µL.Prefer full-loop injections for isocratic work; for UHPLC microbore, use microliter/sub-microliter loops.
Minimize needle seat and pre-injector volumes; enable needle-seat flush to avoid “carryover plugs” of strong solvent.
2) Tubing and Fittings
Cause
Excessive tubing length or too-large internal diameter (ID).
Poorly seated ferrules creating cavities (micro-dead-volume).
Non-zero-dead-volume unions.
Fixes
Use the smallest ID compatible with backpressure and flow. Typical guidance:
UHPLC with 2.1 mm ID columns: 0.005" (125 µm) or 0.003" (75–100 µm) ID.
Analytical 4.6 mm ID columns: 0.005–0.010" (125–250 µm), as needed.Keep tubing lengths as short as practical—especially column outlet to detector (<10–20 cm where feasible).
Use true ZDV fittings; ensure ferrules are properly seated and tubing end-faces meet without gaps.
Mechanistic note:
Even if backpressure is acceptable, a long or oversized tube increases Taylor–Aris dispersion under laminar flow, broadening early peaks in a way that can mimic column inefficiency.
3) Detector Flow Cell and Data System
Cause
Large-volume flow cell.
Long outlet tubing or extra post-cell volumes (tees, splitters).
Low data rate or overly aggressive time constant filtering.
Fixes
Use low-dispersion flow cells:
1–2 µL for UHPLC
3–8 µL for conventional HPLC
Avoid 10–14 µL cells with narrow-bore columns.Shorten post-cell tubing; eliminate unnecessary tees/splitters.
Data acquisition:
Set data rate to at least 10–20 Hz for UHPLC; ≥5 Hz for conventional HPLC.
Set time constant/integration window to ≤1/10 of expected peak width at half-height.
Why it matters:
You can have a physically narrow early peak leaving the column that appears broad or flattened at the detector due to cell volume and digital under-sampling.
4) Mixer and Gradient/Dwell Volume
Cause
Large mixer volume and high dwell volume delay and disperse the initial gradient.
Early peaks broaden or elute later than expected because the initial composition reaching the column is not what the method assumes at that time point.
Fixes
Use smaller mixers for fast gradients and microbore columns (e.g., 50–100 µL rather than 350–1,000 µL).
Compensate dwell volume:
Add an initial isocratic hold, or
Pre-mix the starting composition to sharpen focusing.Consider low-dwell configurations for UHPLC; minimize added static mixers unless needed for baseline quality.
5) Guard Columns, Inline Filters, and Adapters
Cause
Large internal volumes (oversized housings).
Frit cavities or mismatched adapters creating voids.
Fixes
Choose low-volume guards matched to column ID; use short housings.
Replace worn/clogged frits; re-seat to avoid void space at the bed entrance.
If contamination control is needed, prefer inline filters with minimal dead volume and matched fittings.
6) Column Inlet Conditions
Cause
Inlet voids, bed settling, or poor conditioning magnify injection plug dispersion and can create fronting.
Fixes
Replace the column if an inlet void is suspected (fronting persists for early peaks regardless of injection changes).
Use a short sacrificial guard or inlet filter to protect the bed and allow easy renewal.
Ensure proper equilibration at initial composition, especially for gradients.
7) Thermal Mismatch and Viscosity Effects
Cause
Temperature differences between incoming solvent and column produce viscous mixing layers, worsening early dispersion.
Fixes
Use an active pre-heater with thermostatted column compartment.
Allow sufficient equilibration after large changes in mobile phase composition or temperature.
Calculations and Acceptance Criteria
Converting Volume to Time Variance
For a well-mixed element (uniform profile):
σ_ec,t ≈ V_ec / (√12 × F)More generally:
σ_obs^2 ≈ σ_col^2 + Σ(α_i × V_i/F)^2
whereα_idepends on the element geometry (injector plug ≈ 1/√12; laminar tube ≈ 1/(2√3); detector cell often behaves between plug and partially mixed).
Practical Targets
For 2.1 mm ID columns (50–100 mm): keep effective extra-column volume
V_ec≤ 10–20 µL to preserve early peaks.For 4.6 mm ID columns:
V_ec≤ 50–100 µL is typically acceptable.
Example (as provided)
If V_ec = 15 µL and F = 0.4 mL/min (6.67 µL/s):
σ_ec,t ≈ 15 / (3.464 × 6.67) ≈ 0.65 s
Gaussian FWHM from extra-column alone:
w_0.5 ≈ 2.355 × σ ≈ 1.53 s
Early peaks with intrinsic w_0.5 near 1–2 s will be dominated by extra-column dispersion.
Method Strategies to Protect Early Peaks
Strength-match injection solvent and add a short low-organic initial hold to focus analytes on-column.
If analytes elute near
t0, consider:
Reducing initial organic or adding a short isocratic segment to increase k′ for earliest peaks.
Using a trap-and-elute setup (precolumn focusing) for dilute samples in strong diluents.Avoid overly steep initial gradients if dwell volume is large; ramp smoothly or compensate with delay adjustments.
Decision Tree (Actionable Sequence)
Verify with a union test: measure and minimize
V_ec.Shorten and downsize tubing; replace non-ZDV connectors; check fittings for gaps.
Switch to a low-volume flow cell; increase data rate; reduce filtering.
Optimize autosampler: smaller loop, full-loop mode where suitable, seat flush, matched diluent; reduce
V_inj.Reduce mixer/dwell volume or compensate with method timing; add short initial hold.
Remove/replace high-volume guards/filters; verify column inlet integrity.
Reassess early-peak shape and iterate changes that produce the largest improvement.
Common Pitfalls
Using a standard 10–14 µL flow cell with 2.1 mm columns and fast gradients.
Leaving 0.010" ID tubing runs of 50–100 cm from legacy methods.
Injecting pure acetonitrile or methanol onto a highly aqueous start.
Assuming later peaks look fine means dispersion is acceptable—early peaks can still be compromised.
Verification and Documentation
After changes, document new union-test peak width and dwell volume; aim for reproducibility within ±10%.
Record early-peak FWHM, symmetry, and plate counts before/after; target ≥20–30% reduction in early-peak widths when dispersion is the main cause.
Lock method parameters:
Flow,Mixer volume,Data rate,Time constant,Initial composition, andInjection volume/solvent.
Brief Summary
Early-eluting peaks are disproportionately affected by extra-column (dead) volume because intrinsic column broadening is minimal near t0. Reduce dispersion by minimizing tubing ID/length, using true ZDV fittings, lowering detector cell volume, optimizing injection volume/solvent strength, and managing mixer/dwell volume. Confirm improvements using a union dispersion test and appropriate detector acquisition settings.