Sample Particulates and Downstream Flow Path Damage in HPLC
Fix Sample Particulates and Downstream Flow Path Damage in HPLC: checks, likely causes, and corrective actions to reduce pressure spikes.
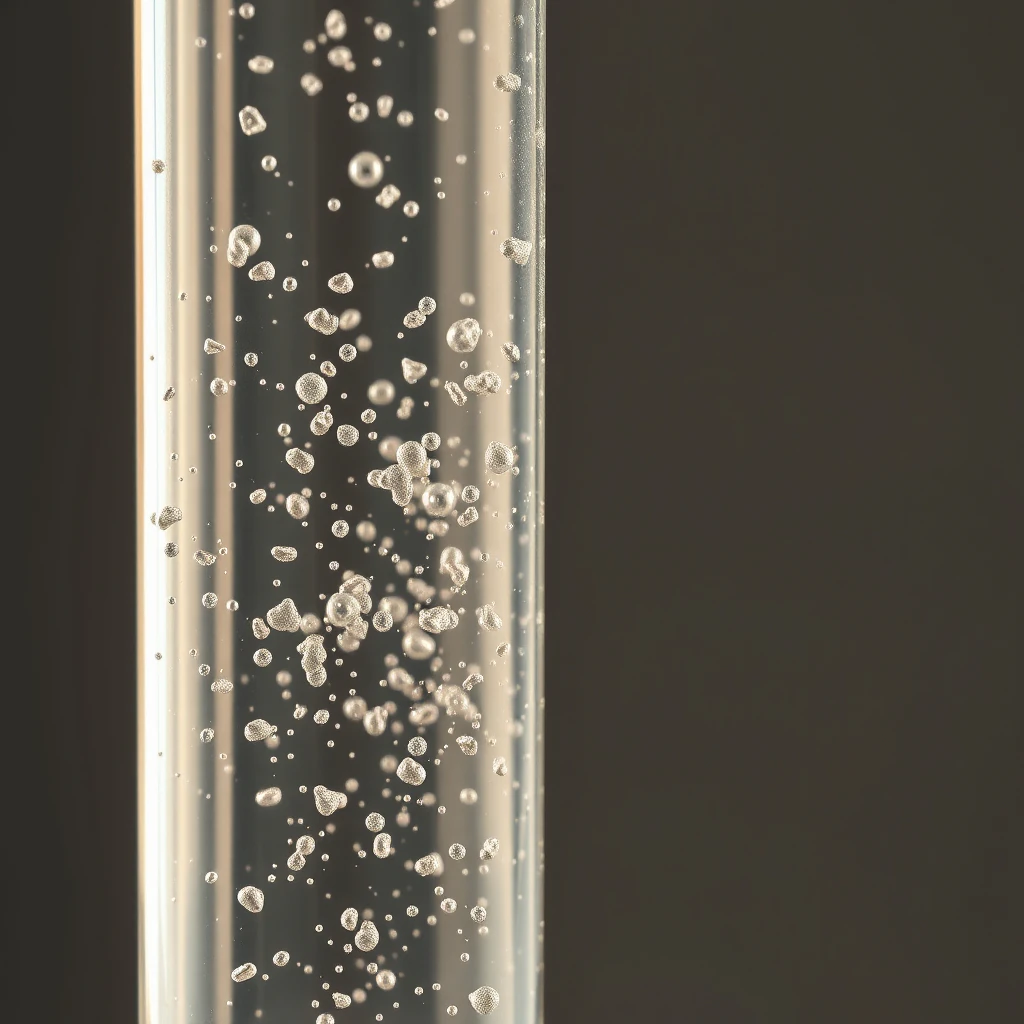
HPLC Troubleshooting Guide for Rising Backpressure, Plugged Frits, Autosampler Restrictions, and Premature Wear
Context and Mechanism
Sample particulates—introduced with the injection, generated by precipitation, or formed in situ—are a leading root cause of HPLC flow restriction and downstream component damage. Particulates can lodge in or on small-pore barriers (commonly frits and filters), accumulate at high-shear interfaces, and abrade moving or sealing surfaces. The resulting restrictions and wear often present as gradual or injection-dependent increases in backpressure and deteriorating chromatographic performance.
Key mechanisms include:
Physical blockage of frits (often in the ~0.2–2 µm range), inline filters, needle seat filters, and capillaries.
Abrasive wear of pump check valves, seals, and injector rotor/stator faces, which can create additional particle shedding and feedback into the system.
Localized restrictions that distort system pressure profiles, increase pulsation sensitivity, and destabilize gradients.
Downstream contamination of detector flow cells and outlet capillaries, sometimes mimicking baseline or detector instability.
In UHPLC (e.g., sub-2 µm columns and narrow-bore tubing), the system is substantially less tolerant of particulates. Small amounts of insoluble material that might be tolerated in conventional HPLC can rapidly block column inlet frits or microbore capillaries, leading to steep pressure rises and sudden performance loss.
Early Warning Signs and Symptoms
Pressure Behavior Signatures (Backpressure and Pulsation)
Gradual increase in system backpressure per injection, often trending upward across a sequence.
Stable pressure during blanks but pressure spikes after sample injections, strongly implicating sample-borne particulates or precipitation triggered by injection.
Increased pressure ripple (apparent pulsation) despite properly primed and degassed solvents—often a secondary effect of restrictions affecting compressibility and flow stability.
Chromatographic Performance Degradation
Widening peaks and loss of efficiency (lower plate count), consistent with restricted inlet frits or disturbed flow distribution.
Irreproducible retention times, especially in gradient methods where restrictions can change effective gradient delay and mixing behavior.
Increased carryover and inconsistent recovery, often due to fouled needle seats, rotor/stator surfaces, or adsorption/entrapment in partially blocked pathways.
Autosampler and Pump Alarms (Instrument-Reported Clues)
Messages such as
needle seat backpressure high,weak draw,stuck check valve, or related warnings.Intermittent prime difficulty or erratic pressure buildup that correlates with restricted or contaminated check valves and inlet pathways.
Visual Cues (Sample and Hardware)
Cloudy samples, visible sediment, or crystals appearing after dilution.
Turbidity in solvent lines or precipitate at fittings (white salt films, rust-like discoloration).
Residue around injector or fittings indicating salt creep, precipitation, or corrosion products.
Common Root Causes of Particulates and Restrictions
Sample-Related Sources
Inadequate filtration or centrifugation prior to injection.
Matrix particulates: excipients, undissolved solids, protein aggregates, lipids, or environmental particulates introduced during handling.
Precipitation upon mixing with mobile phase (diluent/mobile phase incompatibility; “solvent shock” effects).
Microbial growth in aqueous samples producing suspended solids and biofilm fragments.
Method and Chemistry Drivers
Salt precipitation (e.g., phosphate or sulfate) in high organic fractions or during rapid gradients.
pH shifts during dilution or mixing that reduce solubility of analytes or matrix components.
Temperature-induced crystallization, particularly when cold samples or cool lab conditions meet warmer modules (or vice versa).
Viscosity mismatch contributing to local stagnation, promoting crystallization or deposition in dead volumes.
System and Hardware Contributions
Degraded rotor/stator faces shedding material (mechanical wear debris).
Corrosion from aggressive matrices (e.g., chloride-rich samples) generating metallic particulates.
Shedding from consumables, such as low-quality syringe filters, or deteriorating inline frits.
Salt crystallization during idle/shutdown, especially when buffered lines dry or partially evaporate in mixers and fittings.
Diagnostic Workflow: Rapid Isolation of the Restriction
If a blank run is clean and only certain samples cause pressure rise, the issue is overwhelmingly sample preparation or matrix incompatibility.
Step 1: Differentiate Sample vs System
Inject a mobile phase blank:
If pressure stays normal during blanks but rises after sample injections, suspect sample particulates or injection-triggered precipitation.Compare a pressure vs. flow baseline at the method start to identify abnormal restrictions independent of injection.
Step 2: Segment Isolation by Progressive Bypass
Work from the column backward toward the injector/pump:
Bypass guard column
If pressure normalizes, the guard is plugged (expected sacrificial failure mode).Bypass analytical column with a union
If pressure remains high, the restriction is upstream (autosampler, mixer, inline filter, or pump path).Insert tee + gauge (or equivalent pressure read) before the column
Distinguishes upstream restriction from column-only restriction by measuring upstream drop directly.
Step 3: Evaluate Autosampler Flow Path
Inspect and replace the needle seat filter (often 0.5–2 µm), a common particulate trap.
Flush needle path using a staged approach such as
IPA → water → mobile phaseto clear mixed deposits and restore wetting.
Step 4: Pump and Valves
Prime both channels until no bubbles are observed and degassing is stable.
If pressure oscillation persists, sonicate/replace check valves (contamination or crystals can cause sticking and backflow-like behavior).
Step 5: Column Assessment and Reverse Flush (When Appropriate)
If pressure increase is mainly across the column:
Consider controlled reverse flush only when permitted:
Often feasible for many 3–5 µm packed columns.
Avoid for sub-2 µm UHPLC columns unless manufacturer guidance explicitly permits.Use moderate flow (e.g., 0.2–0.5 mL/min as an initial range) and compatible solvent to reduce risk of bed disruption.
Step 6: Detector Flow Cell and Outlet Capillary
If upstream segments check out but pressure remains elevated:
Inspect/flush the detector cell and outlet capillary.
Confirm no post-column restriction is contributing to system backpressure.
Corrective Actions by Component (Targeted Recovery)
Autosampler and Needle Seat
Replace or install a needle seat frit (0.5–2 µm, low-shedding stainless or compatible polymer).
Clean rotor/stator surfaces with
IPAand inspect for grooves; replace rotor seal if scored.
Pump Head and Check Valves
Sonicate check valves in an
IPA/watermixture where appropriate; avoid procedures that risk running components dry under load.Inspect pump seals for wear; replace if shedding polymer fragments.
Mixer and Degasser
Flush salts using staged solvent transitions such as
water → 50:50 water:ACN → ACN.Confirm degasser function; bubbles can mimic restriction-related pulsation and pressure instability.
Guard Columns and Pre-Column Filters
Replace guard columns matched to the analytical phase and particle size.
Add inline pre-column filters (0.2–0.5 µm) for particulate-prone matrices.
Analytical Column
Attempt controlled reverse flush when appropriate.
If efficiency remains degraded (plate loss, tailing), replace the column—frit rescue does not always restore bed integrity.
Detector Flow Cell
Flush with compatible solvents (
water,IPA, and only chemistry consistent with detector and method constraints).Avoid abrasive cleaning; do not mechanically contact cell windows.
Capillaries and Fittings
Inspect for salt crusts or deposits; soak in
waterthenIPAwhere appropriate.Replace severely restricted microbore lines—small-ID restrictions are difficult to recover reliably.
Sample Preparation Best Practices for Particulate Control
Filtration and Clarification
Filter samples with 0.2 µm membranes:
PTFE often used for organic-rich matrices
PES/nylon/PVDF commonly used for aqueous matricesPre-rinse filters to reduce extractables when relevant.
Centrifuge complex matrices (e.g., 10,000–15,000 × g for several minutes) prior to filtration to reduce rapid filter clogging.
Solubility and Diluent Strategy
Match sample diluent polarity to the initial mobile phase to reduce precipitation risk.
Avoid abrupt exposure of salt-rich samples to high-organic environments.
Control pH and ionic strength to maintain analyte and matrix solubility.
For protein/biologic matrices: use precipitation (ACN or MeOH), then clarify and filter; consider acidification only when method-compatible.
Matrix and Container Considerations
Use low-shedding, HPLC-suitable syringe filters.
Verify vial and septa compatibility; some plastics can shed particulates or adsorb analytes.
Microbial Control in Aqueous Samples
Prepare fresh aqueous buffers; store cold when appropriate.
If biocides are used (e.g., sodium azide), confirm compatibility with the analytical method and detector (not typically used for MS workflows).
Preventive Engineering Controls (Protect the System by Design)
Install an inline 0.2–0.5 µm filter immediately after the autosampler to intercept particulates before they reach the column.
Maintain solvent inlet frits (2–10 µm) and replace on a schedule aligned with usage.
Standardize shutdown:
Flush salts with water
Store in 10–30% ACN in water (salt-free) to reduce crystallization and microbial growthFor chloride-rich matrices, consider corrosion-resistant wetted materials where available to reduce metallic particulate formation.
Use guard columns and replace at defined ∆P thresholds relative to baseline.
Maintain an SOP to record pressure at start-of-sequence and define actions when pressure rises beyond a preset fraction of baseline.
Quantitative Reference Points (Use as Operational Triggers)
Typical frit pore sizes: ~2 µm (HPLC), ~0.2–0.5 µm (UHPLC)
Action triggers (trend-based):
Sustained pressure increase >15–20% relative to baseline, or
Absolute increases on the order of tens of bar depending on method/system contextReverse flush (conceptual guidance):
Start at low flow and increase only if stable and permitted by the column manufacturerDegassing context:
Visible microbubbles indicate insufficient degassing, leaks, or temperature/pressure transitions that promote outgassing
(Where exact instrument- or column-specific limits are required, defer to the applicable manual and method validation constraints rather than assuming universal values.)
Special Cases and High-Risk Scenarios
Phosphate Buffers with High ACN
Elevated risk of crystallization in mixers, frits, and needle seats.
Maintain a water-rich flush stage; avoid abrupt transition from high-phosphate aqueous to 100% organic.
Ion-Pair Reagents
Some ion-pair systems can precipitate at high organic fractions.
If method constraints allow, reduce concentration or use alternatives that better tolerate gradients (especially if MS compatibility is required).
Protein-Heavy Matrices
Use precipitation + filtration.
Consider staged filtration (e.g., a coarse pre-filter followed by 0.2 µm) to prevent rapid clogging of the final membrane.
Minimal Recovery Procedure (When Restriction Occurs Mid-Run)
Stop flowandopen purge valvePrime both channels with fresh solvent for several minutes
Restart at low flow (e.g., 0.05–0.1 mL/min) and flush:
water → mixed aqueous/organic → organic (staged)Reintroduce mobile phase and verify baseline pressure
If pressure remains high upstream of the column:
replace needle seat frit
inspect/clean check valves
This staged approach reduces the risk of moving precipitated material into more sensitive downstream components.
Brief Summary
Sample particulates are a primary cause of HPLC backpressure rise, component wear, and method instability. Root causes span inadequate sample clarification, buffer/organic incompatibility, precipitation induced by solvent or pH changes, and hardware shedding or corrosion. A structured isolation strategy—blank vs sample comparison, progressive bypassing, and targeted checks of needle seat frits, guard columns, and check valves—quickly identifies the restriction source. Robust sample preparation, inline particulate interception, and disciplined flushing/storage practices prevent recurrence and protect columns, valves, and detector flow cells.