UV-Vis Detector Flow Cell Backpressure Limits and Damage
Learn how to troubleshoot Detector Flow Cell Backpressure Limits and Damage: common causes and practical remedies to restore normal pressure.
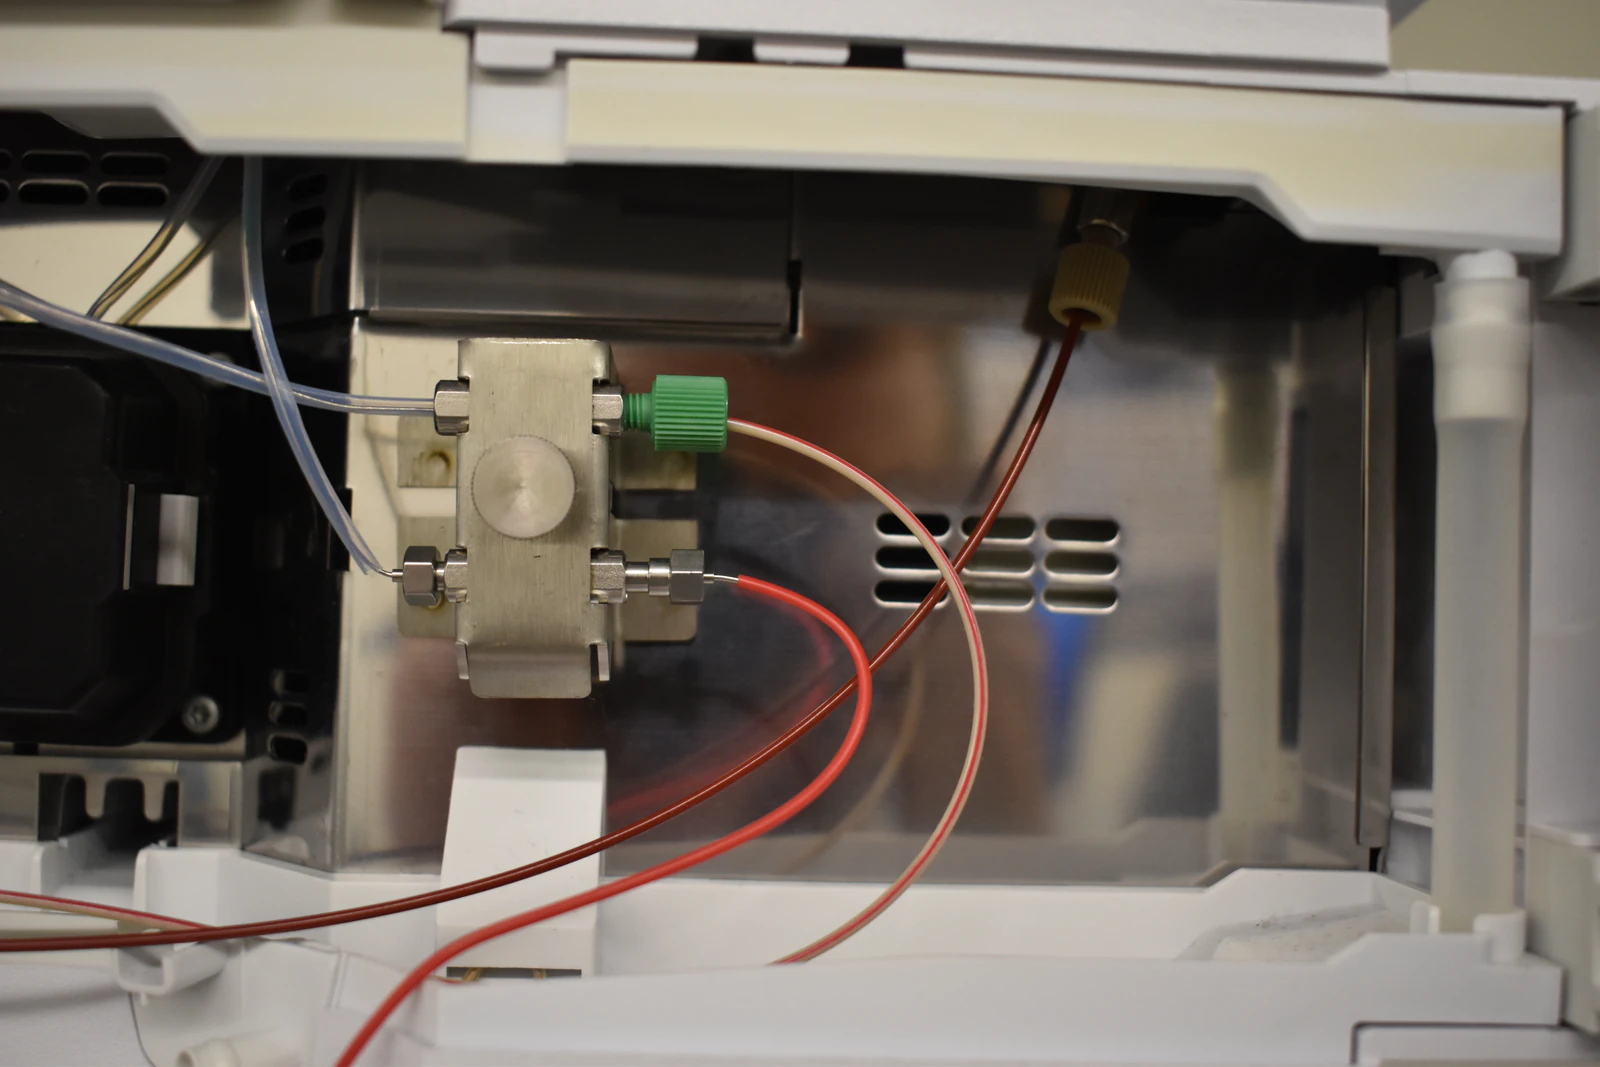
Static vs Differential Pressure, Failure Mechanisms, and Prevention Strategies for UV-Vis Detectors
Executive Overview
UV-Vis detectors in high-performance liquid chromatography (HPLC) rely on a precision-engineered flow cell positioned downstream of the analytical column. While pumps and columns routinely tolerate high system pressures, UV-Vis detector flow cells are comparatively low-pressure components and must be treated accordingly.
Exceeding allowable static pressure or, more critically, differential pressure (ΔP) across the flow cell can result in window fracture, seal deformation, internal channel damage, spectral artifacts, and permanent detector failure.
Always treat a UV-Vis detector flow cell as a low-pressure component unless the manufacturer explicitly certifies higher ratings. Verify both maximum static pressure and maximum differential pressure for your specific cell model.
This technical guide explains:
What backpressure at the detector truly means
How detector pressure develops in LC systems
Typical UV-Vis flow cell pressure limits
Mechanisms of pressure-induced damage
Early warning signs of failure
Pressure estimation principles
Best practices to preserve spectroscopic integrity
What Backpressure Means at the UV-Vis Detector
In liquid chromatography, the detector is exposed to two distinct pressure regimes:
1. Static Pressure
Static pressure is the absolute pressure inside the flow cell cavity, typically influenced by:
Downstream tubing restrictions
Backpressure regulators (BPRs)
Narrow outlet capillaries
Flow restrictions after the detector
When maintained within the manufacturer’s rating, static pressure is usually tolerated if:
Windows are properly supported
Seals are intact
Materials are chemically compatible
2. Differential Pressure (ΔP)
Differential pressure is the pressure drop across the flow cell itself, generated by:
Fluid flow through narrow internal channels
Integrated frits or restrictors
Partial blockages
Channel geometry
Differential pressure represents the primary damage risk because it imposes mechanical stress across the cell windows and seals.
Rapid pressure fluctuations amplify this risk.
Typical UV-Vis Flow Cell Pressure Limits
UV-Vis flow cells are not standardized. Designs vary by:
Optical pathlength
Channel dimensions
Window material (quartz, sapphire)
Seal material (PEEK, PTFE, FFKM)
Intended application (analytical, microvolume, preparative)
In practice:
Many analytical UV-Vis cells tolerate only low differential pressures
Static pressure limits may be higher but must still be verified
Microvolume cells with narrow channels are especially sensitive
Always confirm:
Maximum static pressure
Maximum differential pressure
Temperature limits
Solvent compatibility
Window and seal material ratings
Operating outside these parameters risks irreversible damage.
Key Factors That Increase Detector Backpressure
Understanding hydraulic resistance in the detector region is essential for preventing damage.
1. Flow Rate (Q)
Pressure drop increases with volumetric flow rate.
Increasing flow can substantially elevate ΔP.
2. Mobile Phase Viscosity (μ)
Viscosity strongly influences pressure drop. Elevated viscosity occurs with:
High aqueous content at low temperature
High organic mixtures at low temperature
High salt concentration
Polymer-containing eluents
3. Temperature
Viscosity decreases with temperature.
Cooling increases hydraulic resistance and detector stress.
4. Tubing Internal Diameter (ID) and Length
Small-ID tubing increases resistance
Long outlet tubing increases static pressure
Narrow tubing near the detector can elevate local ΔP
5. Inline Frits and Filters
Fine-porosity frits near the detector can clog, causing:
Abrupt differential pressure spikes
Localized jetting
Uneven window stress
6. Flow Cell Geometry
Narrower channels and longer pathlengths increase hydraulic resistance.
Estimating Pressure Drop Across the Flow Cell
For a simplified circular channel model, pressure drop scales approximately as:
ΔP ∝ μ × L × Q / d⁴
Where:
ΔP = pressure drop
μ = viscosity
L = channel length
Q = volumetric flow rate
d = channel diameter
Although real UV-Vis flow cells often use rectangular channels and include entrance/exit losses, the proportionality trend remains valid:
Small decreases in channel diameter cause large increases in pressure drop (d⁴ dependence)
Pressure drop increases linearly with viscosity
Pressure drop increases linearly with flow rate
Practical Implication
Doubling flow rate increases ΔP proportionally
Slight channel narrowing (e.g., partial blockage) dramatically increases stress
Viscous mobile phases significantly elevate detector risk
Mechanisms of Flow Cell Damage from Over-Pressure
Excessive differential pressure or rapid pressure changes can cause:
1. Window Fracture or Chipping
Quartz or sapphire windows may crack due to:
Uneven loading
Localized blockage
Differential stress gradients
2. Seal Extrusion or Compression Set
Polymeric seals (PEEK, PTFE, FFKM) can:
Deform permanently
Extrude into flow channels
Cause leaks
Alter effective pathlength
3. Internal Channel Obstruction or Deformation
Particles and precipitates may:
Increase local velocity
Cause shear stress
Elevate differential pressure
Create permanent flow distortion
4. Adhesive or Bonding Failure
High stress or incompatible solvents may weaken bonding interfaces.
5. Cavitation and Microbubble Damage
Rapid depressurization or outgassing can produce:
Microbubbles
Light scattering
Baseline instability
Spectral noise
Spectroscopic Consequences of Detector Over-Pressure
Mechanical stress translates into optical distortion.
Microbubbles and Cavitation
Increase stray light
Elevate baseline noise
Degrade signal-to-noise ratio
Increase limit of detection
Window Misalignment or Damage
Alters effective optical pathlength
Causes absorbance nonlinearity
Produces wavelength-dependent artifacts
Increased Hydraulic Dispersion
Broadens chromatographic peaks
Reduces resolution
Decreases quantitative precision
Pressure-induced mechanical stress therefore directly compromises chromatographic performance and analytical accuracy.
Early Warning Signs of Excess Detector Backpressure
Recognize these symptoms early:
New or worsening leaks at the detector
Baseline oscillations that scale with flow rate
Elevated pressure downstream of the detector
Retention time shifts after the detector
Decreased sensitivity or absorbance offsets
Persistent microbubbles despite proper degassing
Prompt intervention prevents catastrophic failure.
Best Practices to Prevent UV-Vis Flow Cell Damage
1. Verify Pressure Ratings Before Method Changes
Always confirm maximum static and differential pressure before:
Increasing flow rate
Adding a backpressure regulator
Changing solvent composition
2. Maintain Controlled Downstream Backpressure
Use moderate backpressure to suppress outgassing, but do not exceed static rating.
3. Manage Flow Rate for Viscous Mobile Phases
For high-viscosity methods:
Reduce flow rate
Increase temperature within validated method limits
4. Use Appropriate Tubing Dimensions
Avoid excessively small ID tubing immediately before or after the detector.
5. Minimize Fine-Porosity Frits Near the Detector
If filtration is required:
Place filters upstream
Monitor for clogging
Replace preventively
6. Maintain Clean and Compatible Mobile Phases
Filter and degas solvents
Avoid buffer crystallization
Prevent polymer precipitation
Flush salt-containing methods with water
Displace water with miscible organic solvent after flushing
7. Avoid Solvent Incompatibility
Confirm compatibility with:
Window material
Seal material
Adhesives
8. Avoid Pressure Shocks
Increase and decrease flow gradually.
Avoid sudden valve switching that induces rapid ΔP changes.
9. Schedule Preventive Maintenance
Inspect for leaks
Clean flow cell
Replace worn seals
Monitor baseline stability trends
Measuring Differential Pressure Across the Detector
A practical and rigorous approach:
Install pressure transducers immediately upstream and downstream of the flow cell.
Measure ΔP under typical operating conditions.
Compare measured differential pressure to conservative operating limits.
If ΔP approaches vendor limits:
Reduce flow rate
Adjust temperature
Increase tubing ID
Clean or replace frits
Monitoring ΔP during method development protects both hardware and data integrity.
Summary: Protecting UV-Vis Detector Flow Cells in HPLC
UV-Vis detector flow cells are precision optical components that operate under comparatively low pressure relative to LC columns and pumps. Differential pressure, viscous mobile phases, clogging, excessive flow rates, and solvent incompatibility can induce mechanical and spectroscopic damage.
To preserve analytical performance:
Operate within verified pressure ratings
Manage tubing and frit configuration
Control viscosity and temperature
Suppress outgassing responsibly
Recognize early stress indicators
Protecting the UV-Vis detector flow cell is not only a hardware concern—it is essential for maintaining baseline stability, peak integrity, quantitative accuracy, and long-term chromatographic reliability.